Build interactive Tableau views and integrate Python-based calculations to communicate operational insights. 1. Who can join Suitable for: BI developers, data analysts and Tableau users Mandatory prerequisites: Spreadsheet/analytics experience; beginner Python and Tableau helpful 2. Duration 44 live hours • Approximately 8 weeks at 6 hours per week; actual timetable to be confirmed. 3. Mode Classroom - Thaiyur / Kelambakkam, OMR Chennai (subject to schedule) Live Online (subject to schedule)
4. Syllabus — five modules
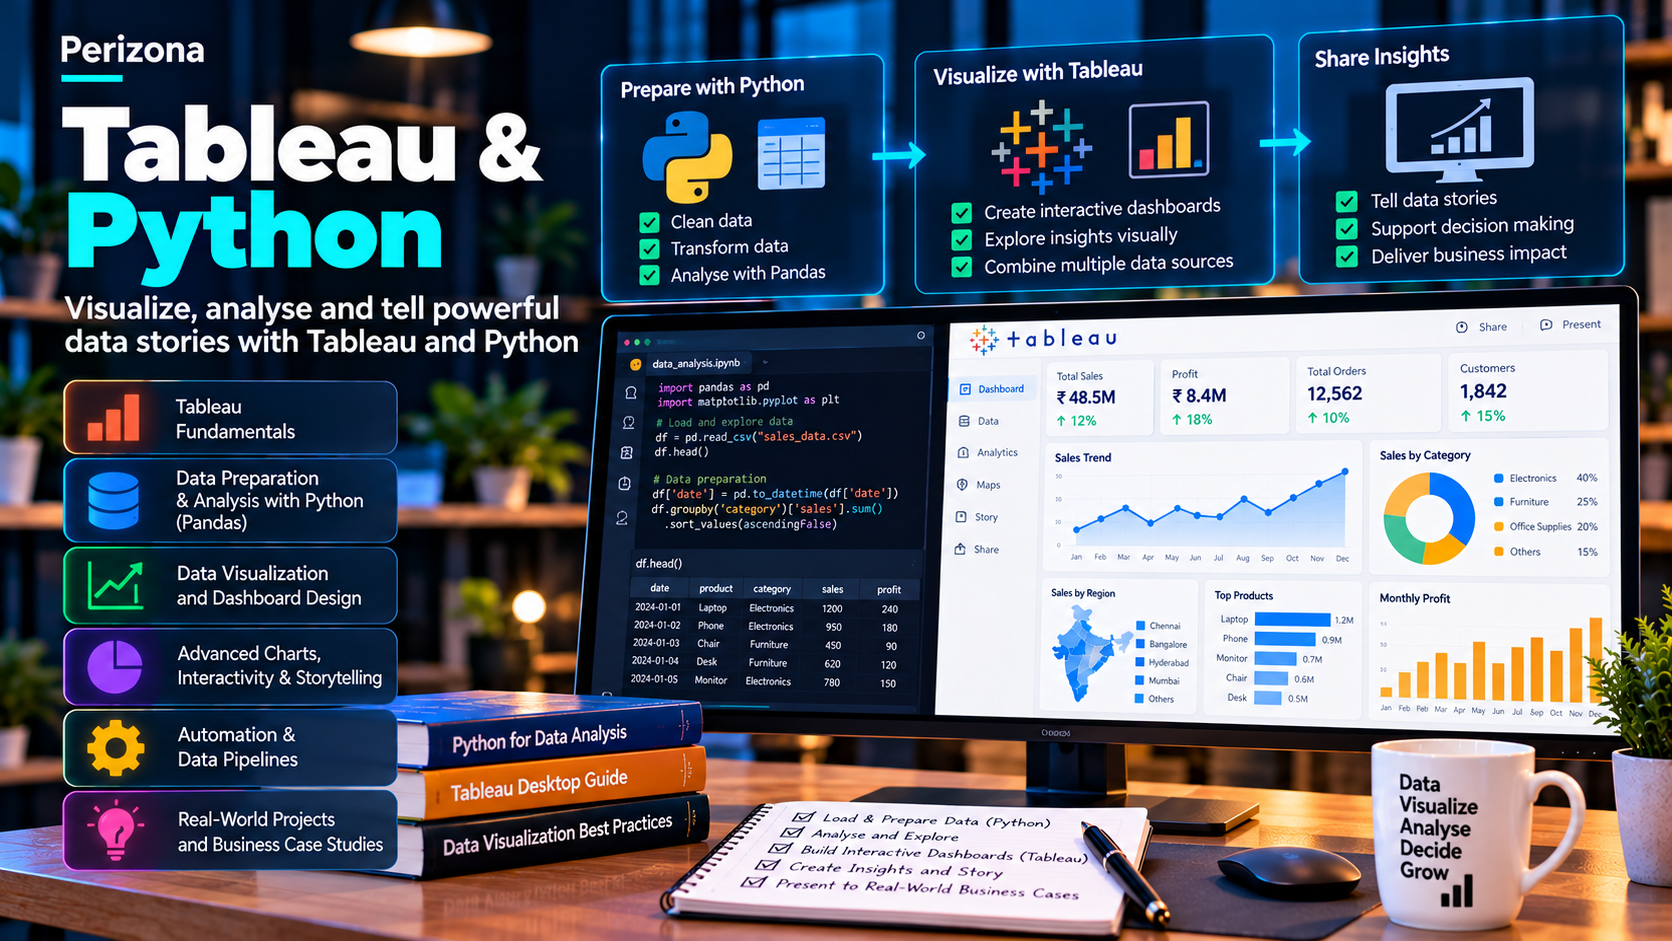
Module 1: Data Connection, Calculations & LOD (Level of Detail) Expressions in Tableau Learning outcome: Create Tableau calculations and level-of-detail expressions. Module 2: Interactive Visualizations, Parameters & Dynamic Dashboards Learning outcome: Build dynamic dashboards with filters and parameters. Module 3: Python Integration (TabPy) for Advanced Statistical Analytics Learning outcome: Connect Python analytics through a controlled TabPy example. Module 4: Designing Executive Scorecards & KPI Story Points Learning outcome: Design executive-friendly scorecards and narrative insights. Module 5: Publishing, Automated Refresh Schedules & Server Management Learning outcome: Explain publishing, refresh and access-control considerations. 5. Practical project Source capstone title: Deliver a Supply Chain Optimization Visual Dashboard with TabPy Integrations Student deliverable: A supply-chain dashboard with inventory, delivery and service metrics, including at least one Python-powered analytic result.
6. What is included Live trainer-led sessions Practical assignments Sample code or templates, as applicable Project feedback Learning assessment Perizona course-completion certificate subject to assessment 7. Upcoming batch Start date: To be announced. Students can register interest; dates are shared only after confirmation.